

ZEROing in on Defects
Dimensional measurement data provides operators with actionable decision making that first reduces, and then eventually eliminates defects.
Posted: November 24, 2021


TOWARD ZERO DEFECTS
By Michael Creney
In the early 1960s Philip Bayard “Phil” Crosby of the Martin Company initiated a zero defect program, in response to the quality crisis in American manufacturing. Crosby created the DRIFT principle, “doing it right the first time” and the performance standard of “zero defects” was one of the four principles.
First, let’s define how metrology can address one of the defect categories, manufacturing defects. Most quality professionals classify the defects in three categories: minor, major and critical. The concept of zero defects may suggest treating all defects as critical. The overall goal of zero defects, of course, is to eliminate all defects.
Using data collection technologies are a proven method to gain insights on dimensional measurement data that leads to actionable decision making that first reduces and eventually eliminates defects. Most modern metrology tools are digital, so data collection is available by any number of methods including traditional cable connection or wireless relay.
Simple and easy-to-use data collection is the preferred method for most operators. With immediate operator feedback and visualization of pass/fail tolerance conditions, for example, throughput is increased dramatically without compromising measurement accuracy.
SPC – THE EMPOWERMENT OF DATA DRIVEN STATISTICS
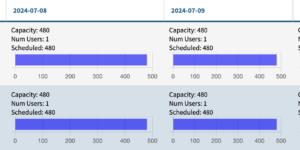
For many customers, the achievement of zero defect starts with a simple process but usually requires more complex tools to capture, categorize and characterize product data. The use of Statistical Process Control (SPC) software platforms has helped quality professionals collect and analyze data as part of the overall Total Quality Management System (TQM) platform. Many organizations have adopted these SPC software products to enhance productivity. Mitutoyo offers MeasurLink® with enhanced tools such as the ability to define variable and attribute data, traceability, and multiple evaluation methodologies, to provide a more comprehensive data collection platform.
Pinnacle Machine Works, a Houston-based oilfield couplings and pipe manufacturer offers a real-world example on the effectiveness of SPC achieving zero defects. Pinnacle reached out to Mitutoyo when the company quickly expanded in size and product orders increased.
As Pinnacle grew, in late 2017 they embarked on a mission to transform and improve productivity. This involved a re-organization of the manufacturing plant, the rollout of lean initiatives and an investment in new tooling. As this transformation progressed, it unveiled additional opportunities for improvement. In particular, it became clear that quality still needed to improve and inspection only, as a means of improving the quality of their product, was not possible.
Pinnacle made the choice of switching over to digital gages that allow for real-time data collection and the use of SPC instead of increasing labor costs in their QC operations. Converting to SPC, combined with Mitutoyo MeasurLink suite, Pinnacle made serious improvements to the manufacturing process to improve quality.
In the first year of implementing MeasurLink on the coupling shop floor, Pinnacle’s reject rate dropped from 3 to 1.3%. At the same time, overall shop productivity increased by 45%. To date, the company’s reduction in the instance of non-conforming product has saved the company more than $180K in lost material alone.
FINDING THE CAUSE
In many instances, the use of Root Cause Analysis can be applied to the process to identify where, why and how the defect is being generated. There are multiple techniques to which are typically part of a TQM. To gain a better understanding of the methods and best practices, visit the American Society for Quality (ASQ) website, https://asq.org/quality-resources/root-cause-analysis
CORRECTING THE DEFECTS
Once a defect has been defined, the next step is to make changes to the production system. Management typically has the authority to make these changes. Usually, a lot of consideration and examination of the root causes are used to affect these changes. In some cases, it may be a simple change of a process or material, but in other cases high costs, loss of production time and other factors can slow the process considerably. Fortunately, the elimination of a defect is in everyone’s best interest.
While the possibility of zero defects exists in practice, the ultimate achievement of zero defects in a product are difficult to obtain. Time, effort, expenses, and resources are the typical prohibitive factors in obtaining the end result.
In this article we talked about dimensional defects, but there are other more difficult to quantify defects. Manufacturers like Mitutoyo are leveraging the power of Artificial Intelligence (AI) to replicate and surpass the human evaluation of visual defects. This class of defects, typically known as scratches, dents, and dings, are highly subjective and usually dependent on operator interpretation. Using high resolution cameras and synchronized lighting integrated into an inspection line, and by using AI to create an inspection model, can offer customers a glimpse of the future of visual defect detection.
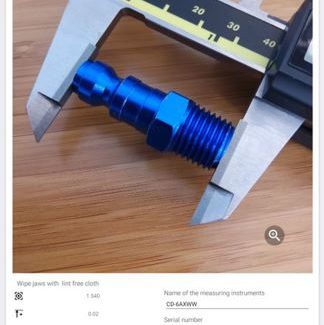
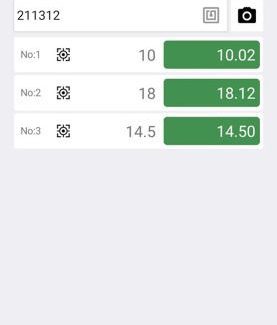
MEASUREMENT DATA INSTANTLY ON YOUR PHONE
Using a caliper with wireless data connectivity and a simple phone-based application allows operators to immediately identify and determine dimensional defects. Preparation of the measurement process is simplified using image-based step by step instructions. Data is transferred via BlueTooth and a simple push of a button on the gage.
Subscribe to learn the latest in manufacturing.


Industry News